top of page

Project 1
March 3, 2019
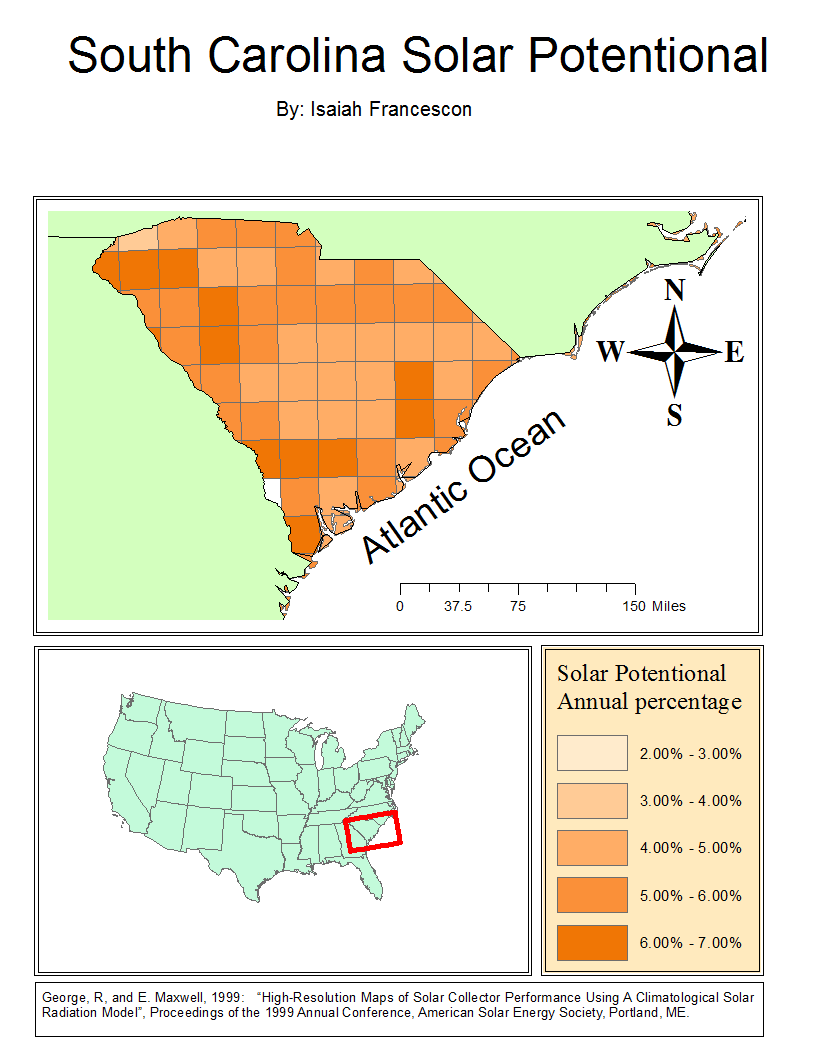
This data is showing the solar potential for the U.S state of South Carolina. The solar potential is represented in Kwh/ per day. The intervals give the representation of how much it could produce.
bottom of page
March 3, 2019
This data is showing the solar potential for the U.S state of South Carolina. The solar potential is represented in Kwh/ per day. The intervals give the representation of how much it could produce.